The 2026 Winter Rental Report: A Two-Month Deep Dive into the Netherlands Housing Crisis (Jan - Feb)
Want to see what rentals are appearing right now?
Explore the MarketThe 2026 Winter Rental Report: A Two-Month Deep Dive into the Netherlands Housing Crisis (Jan - Feb)
Published: March 06, 2026
As we move into the spring of 2026, the Dutch rental market remains one of the most challenging in Europe. Our analysis of the first two months of the year reveals a market defined by extreme supply volatility, persistent price pressure, and a growing regional divide. With a national housing shortage now estimated at a record 410,000 units [1], the data from January and February 2026 provides a clear picture of the "new normal" for renters in the Netherlands.
1. The Supply Landscape: The "January Peak" and the "February Freeze"
The first two months of 2026 saw a dramatic shift in supply. After a strong start in early January, the market experienced a significant contraction as the month progressed, leading into a "February Freeze" where new listings reached their lowest levels of the year.
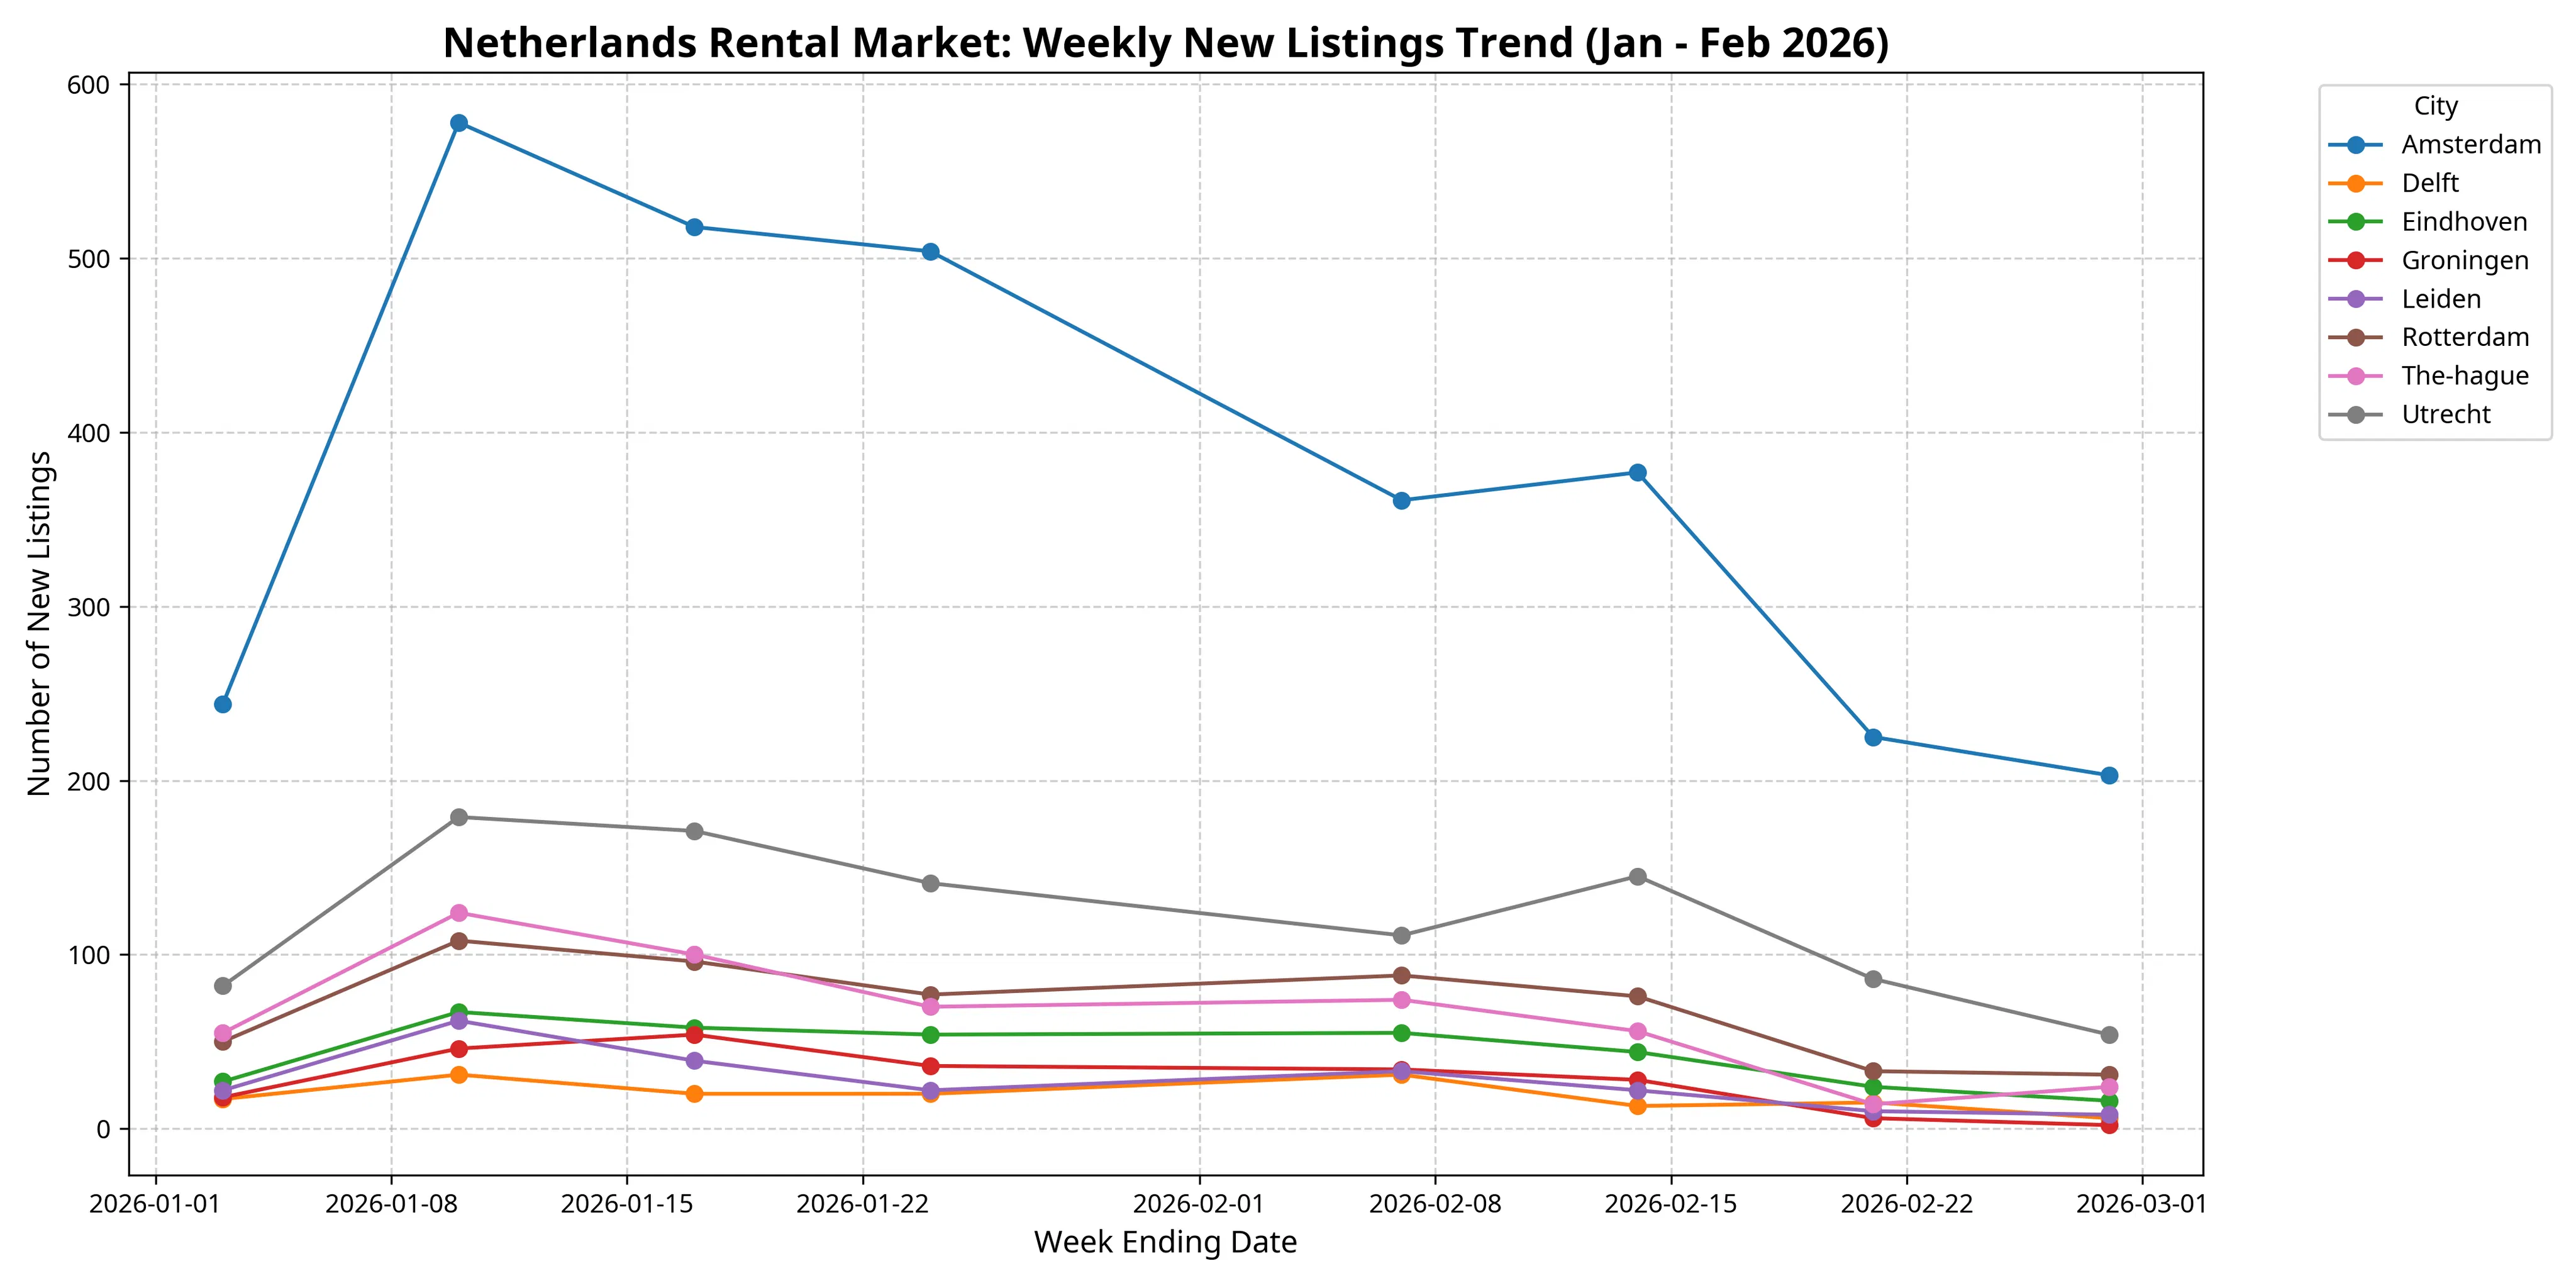
| City | Total New Listings (Jan-Feb) | Avg Weekly Listings | Peak Week (Jan 10) |
|---|---|---|---|
| Amsterdam | 3,010 | 376 | 578 |
| Utrecht | 969 | 121 | 179 |
| Rotterdam | 559 | 70 | 108 |
| The Hague | 517 | 65 | 124 |
| Eindhoven | 345 | 43 | 67 |
| Groningen | 224 | 28 | 54 |
| Leiden | 218 | 27 | 62 |
| Delft | 153 | 19 | 31 |
Table 1: Consolidated supply statistics for Jan-Feb 2026. [2]
News Insight: The January Peak was driven by the traditional New Year's moving rush, but the subsequent 40% drop in supply by late February is a direct result of the "Great Rental Vanishing" [3]. Landlords are increasingly exiting the market due to stricter rental regulations and the Affordable Housing Act, permanently removing thousands of units from the rental pool [4].
2. The Price of Living: The €2,000 Barrier and the "Utrecht Miracle"
Rental prices in the major economic hubs have remained stubbornly high, with Amsterdam and The Hague consistently testing the limits of affordability.
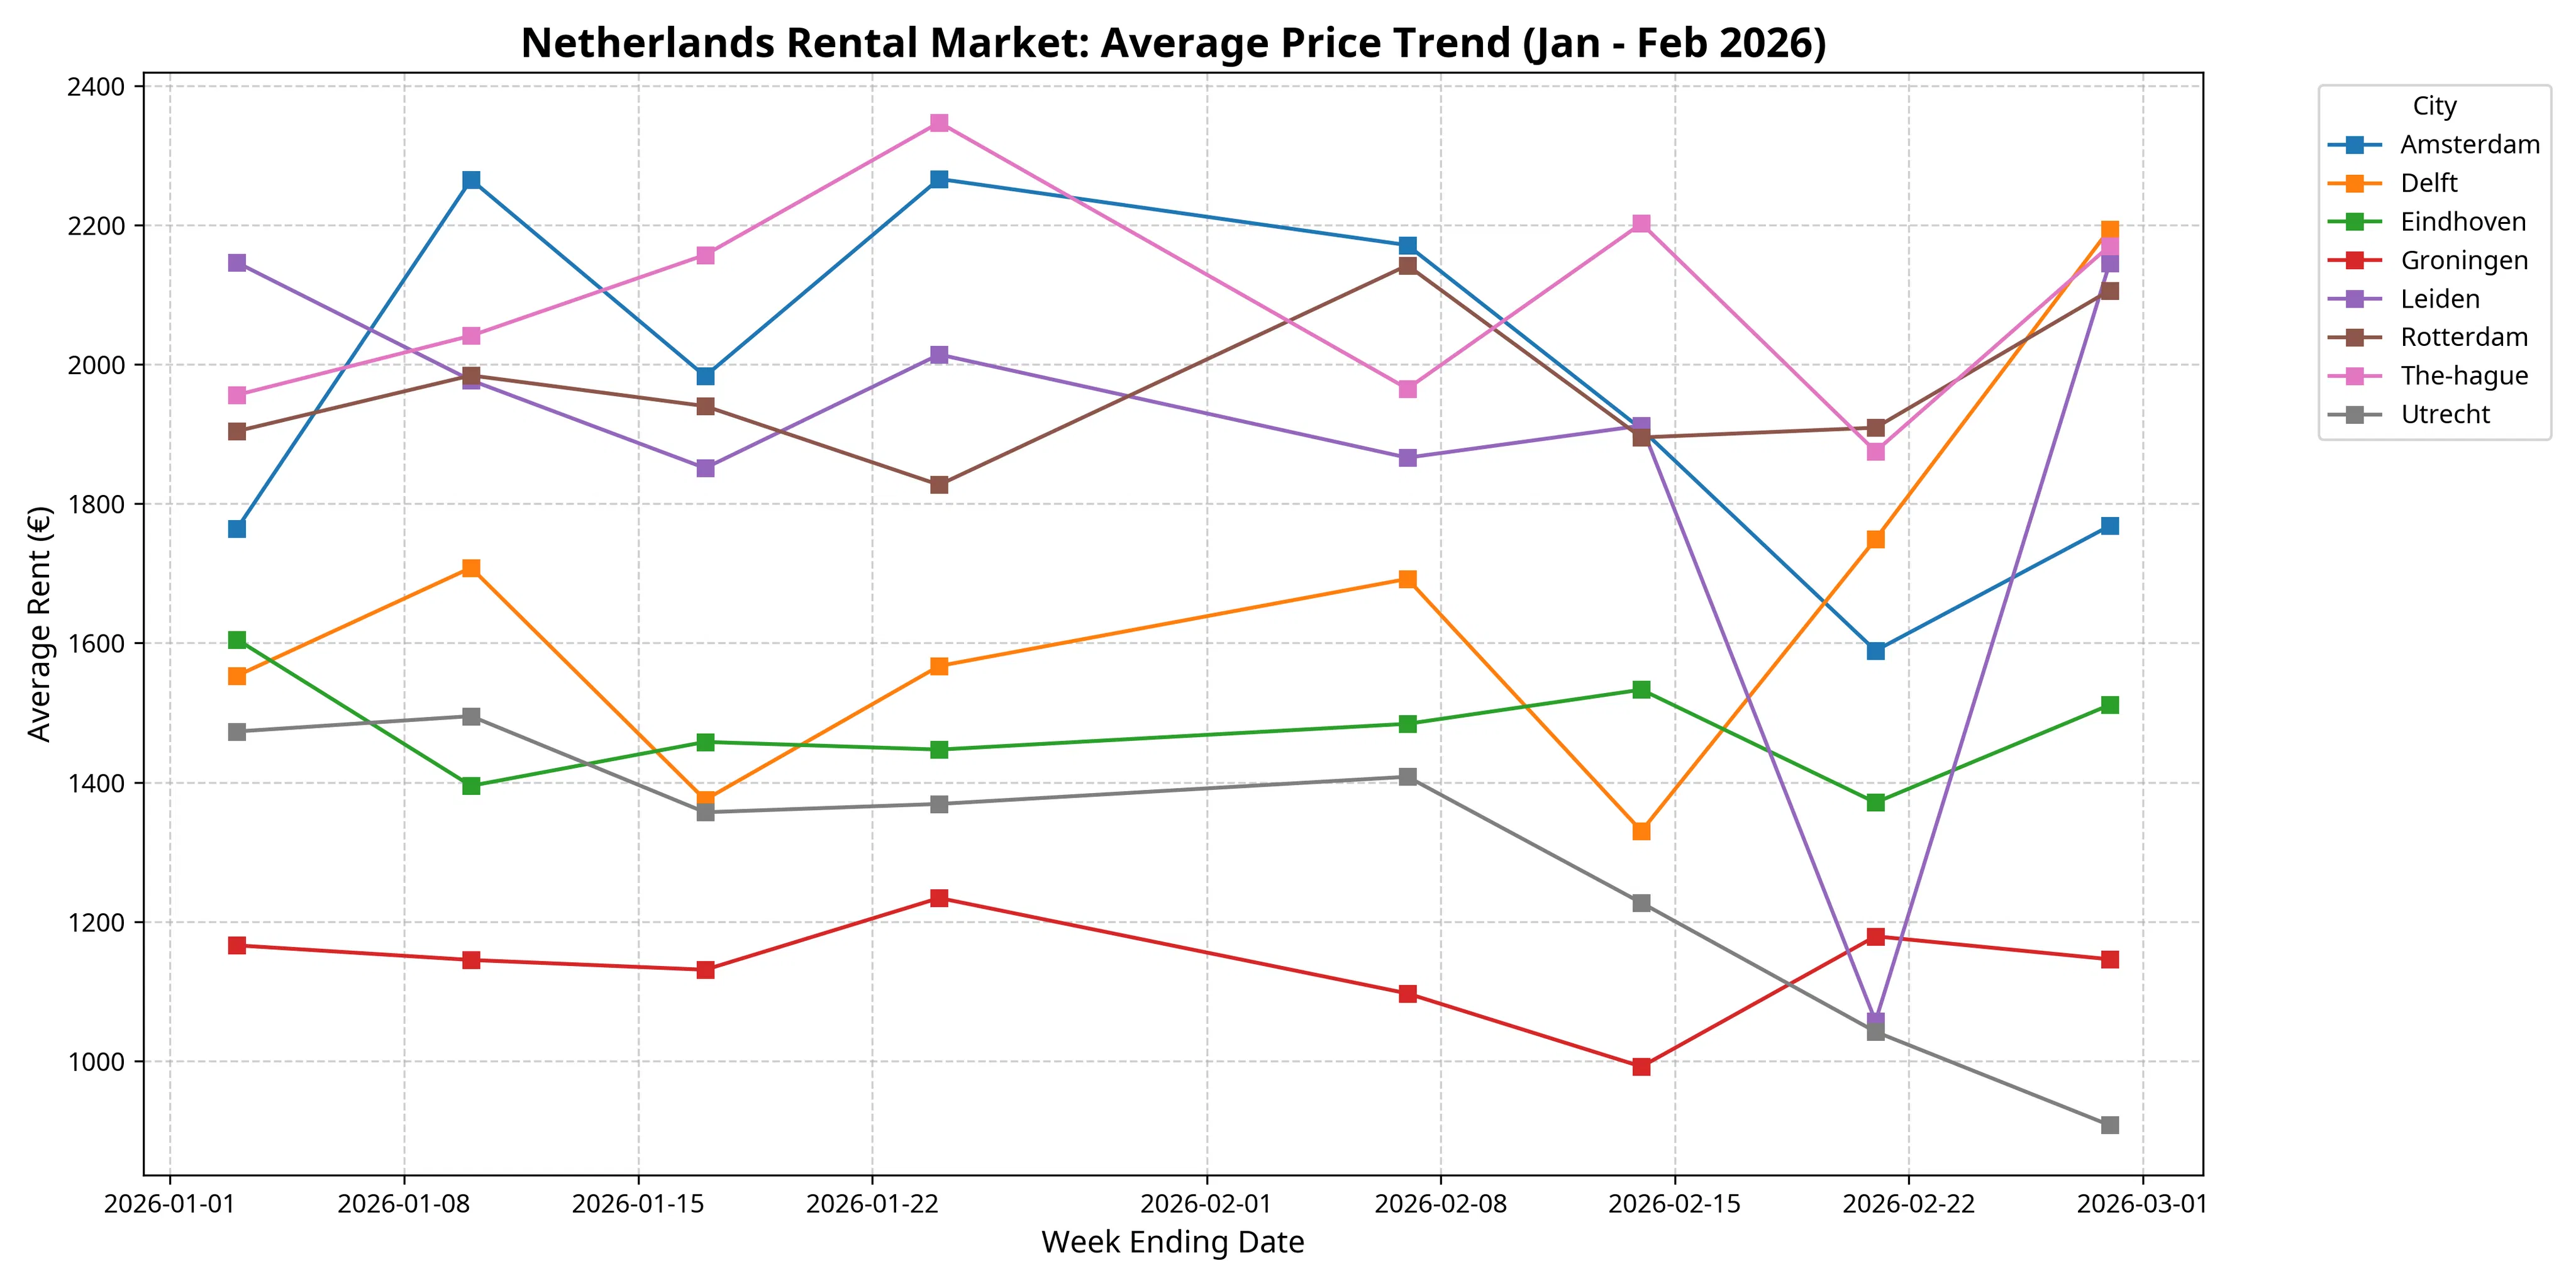
The Regional Divide:
- The Premium Tier: Amsterdam (€1,964 avg) and The Hague (€2,089 avg) have solidified their position as the most expensive cities. The Hague, in particular, saw a surge in high-end listings in late January, with average prices peaking at €2,347.
- The "Utrecht Miracle": Despite being a major hub, Utrecht (€1,285 avg) has emerged as the ultimate value city for the Randstad. It offers a significant discount compared to Amsterdam while maintaining a relatively high volume of listings.
- The Student Hubs: Groningen (€1,136 avg) remains the most accessible major city, though its low volume (avg 28 listings/week) makes it a highly competitive market for students and young professionals.
3. The Cost of Space: A Size-Based Analysis (February Focus)
In February, we introduced a more granular analysis of apartment sizes, revealing how the "cost of space" varies across the country.
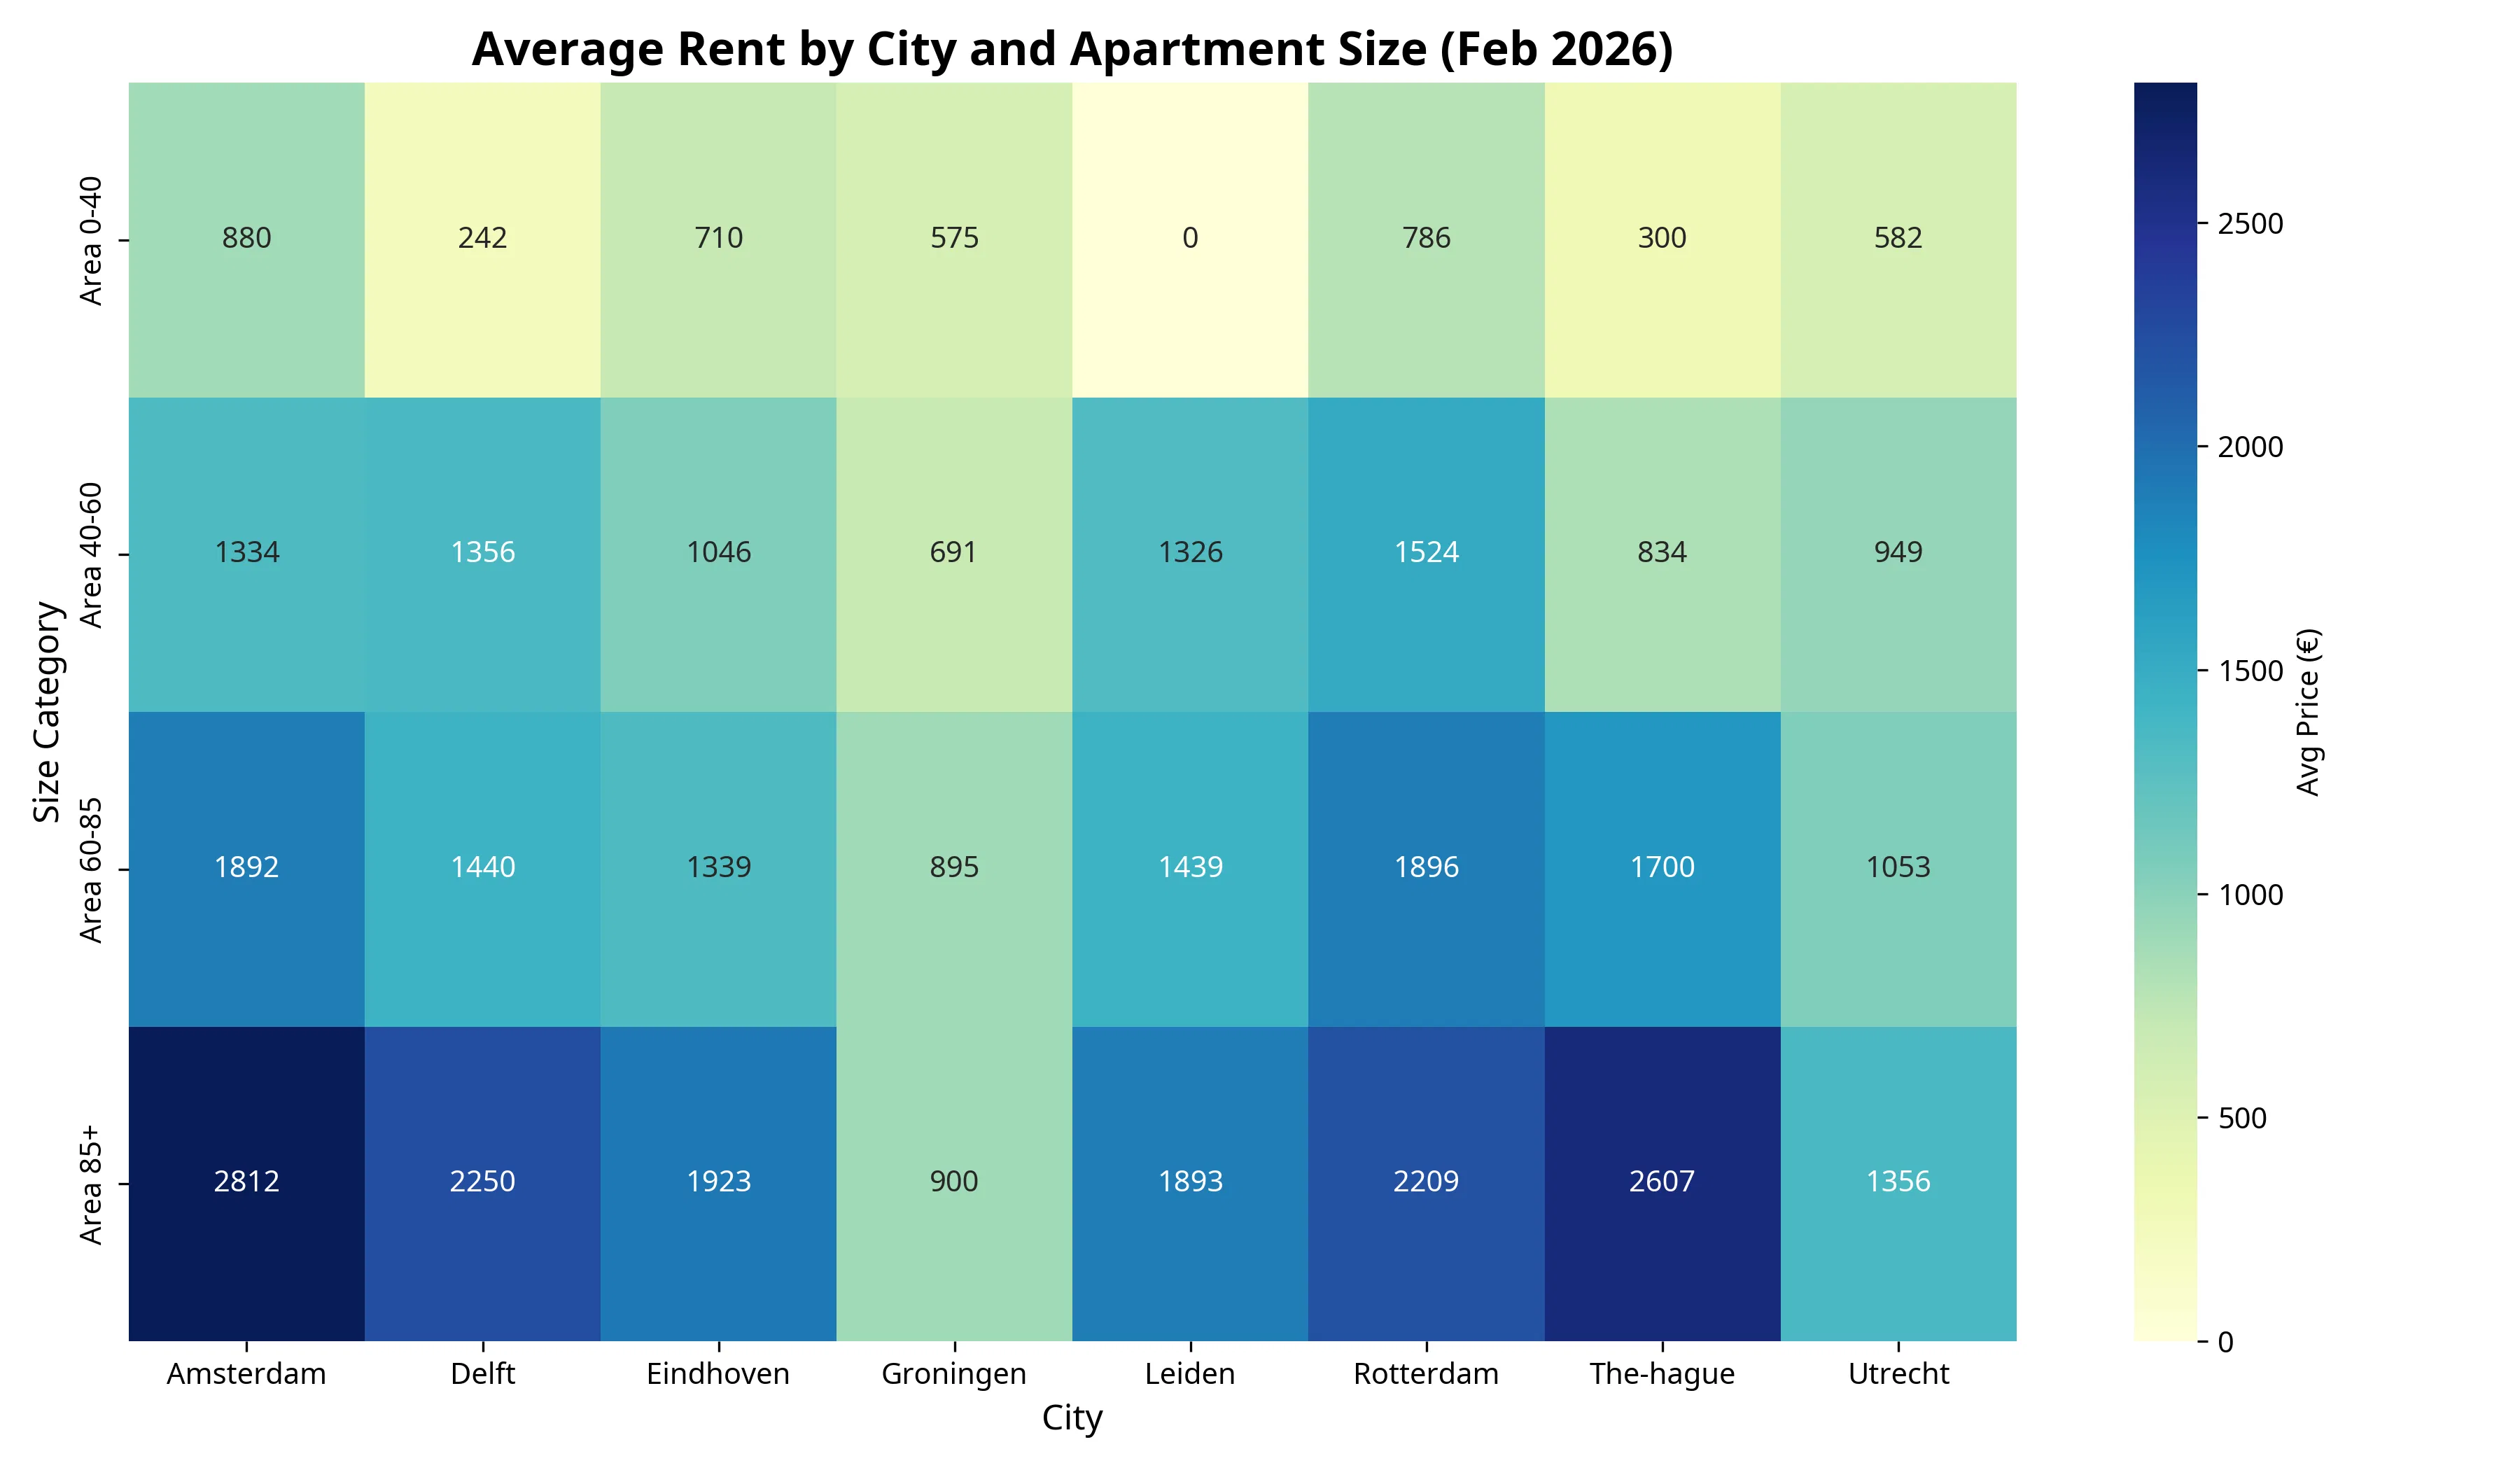
Key Findings:
- The Studio Squeeze: Small units (0-40 m²) are the most competitive segment. In Amsterdam, these average €833, but in cities like Groningen, they can still be found for under €800.
- The Family Home Crisis: Large units (85+ m²) in The Hague and Amsterdam are now averaging nearly €3,000, requiring a household income of over €100,000 to satisfy the "3x rent" rule.
- The Mid-Size Value: The 40-60 m² segment in Utrecht and Eindhoven offers the best balance of price and space, with averages hovering around €1,000 - €1,400.
4. Strategic Takeaways: Navigating the 2026 Market
The data from the first two months of 2026 suggests a market that requires a new level of preparedness and speed.
- The "11 AM Rule": Our timing analysis confirms that the 12:00 - 16:00 window is the absolute peak for new listings. To be successful, you must be ready to apply within the first hour of a listing appearing.
- The Income Barrier: With average prices in the Randstad near €2,000, the "3x rent" rule is a formidable barrier. If your income is under €60,000, your best chances of success are in Utrecht, Eindhoven, or Groningen.
- The Speed Mandate: In a market where supply is vanishing, speed is your only competitive advantage. Using a platform like notirent to get instant alerts is no longer a luxury—it is a requirement for success.
Final Advice: As we enter the spring season, broaden your search immediately. The "Utrecht Miracle" is real, but as more people flee the Amsterdam price hikes, even Utrecht's inventory will come under pressure. Prepare your documents, set your alerts, and be ready to act the moment a listing appears.
Stay tuned to notirent.com for the latest data-driven insights into the Dutch rental market!
Data Sources & News References: [1] "Dutch housing shortage grows as investors turn their backs," DutchNews.nl, Feb 3, 2026. [2] notirent.com internal market tracking data, Jan 01 - Feb 28, 2026. [3] "Housing Crisis Netherlands 2026: The Great Rental Vanishing," The Dutch Daily, Feb 12, 2026. [4] "In the Netherlands, landlords are getting rid of apartments," Logos Press, Feb 5, 2026. [5] "ABN AMRO: Housing market monitor - Will 2026 be an unexceptional year?" ABN AMRO, Jan 11, 2026.
Part 2: Amsterdam Deep Dive – The Capital's Rental Crisis (Jan - Feb 2026)
As the primary economic and cultural hub of the Netherlands, Amsterdam remains the epicenter of the national housing crisis. While the capital offers the highest volume of new listings, it also presents the most significant barriers to entry for renters. In this second part of our winter review, we take a detailed look at the specific dynamics of the Amsterdam market over the first two months of 2026.
1. Supply vs. Price: The Volatile Equilibrium
Amsterdam's rental market in early 2026 has been characterized by a sharp inverse relationship between supply and price. As inventory fluctuates, the "Amsterdam Premium" remains a constant challenge for house hunters.
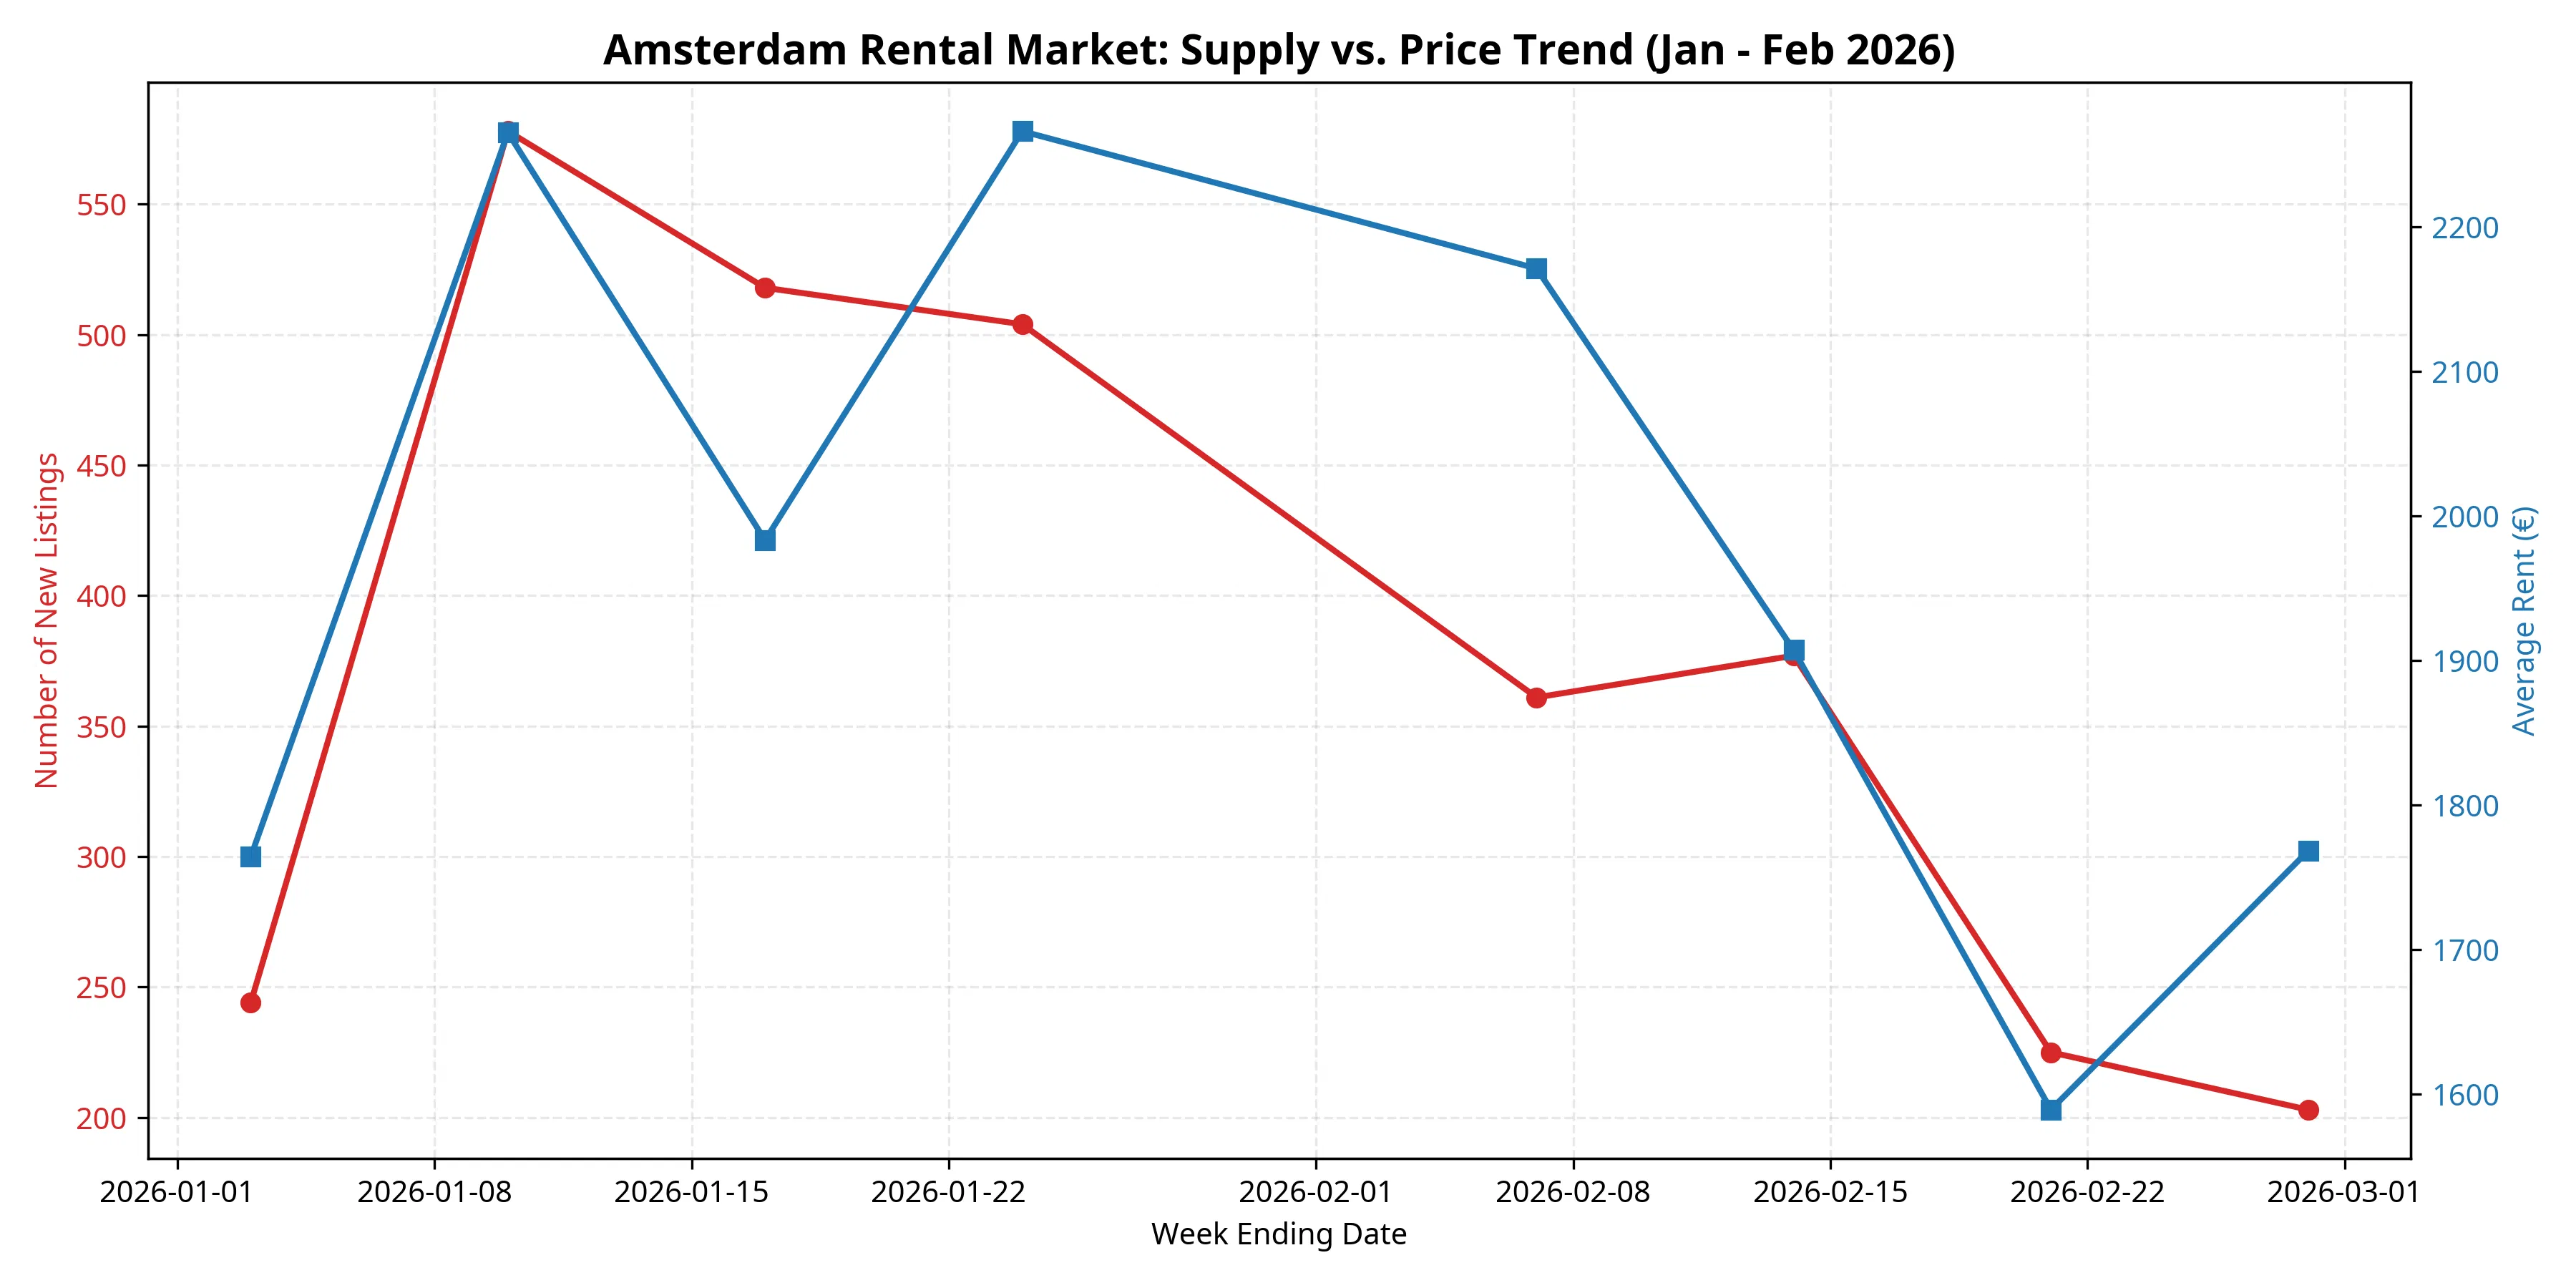
Key Observations:
- The January Peak: Amsterdam reached its highest supply level in the week ending January 10, with 578 new listings. During this period, average prices also peaked at €2,265, driven by a surge in high-end, new-year inventory.
- The February Contraction: By late February, the weekly supply had plummeted to just 203 listings—a 65% decrease from the January high. This contraction is a direct result of the "Great Rental Vanishing," as landlords exit the market in response to stricter rent controls [1].
- Price Volatility: Despite the drop in supply, average prices have shown significant volatility, dipping to €1,589 in mid-February before rebounding. This suggests a market that is highly sensitive to the specific mix of luxury vs. mid-range properties hitting the market each week.
2. The Cost of Space: Size-Based Market Segmentation
In February, our data allowed for a deeper look at how rent scales with apartment size in the capital. The results highlight a steep "space tax" for those seeking more than a studio.
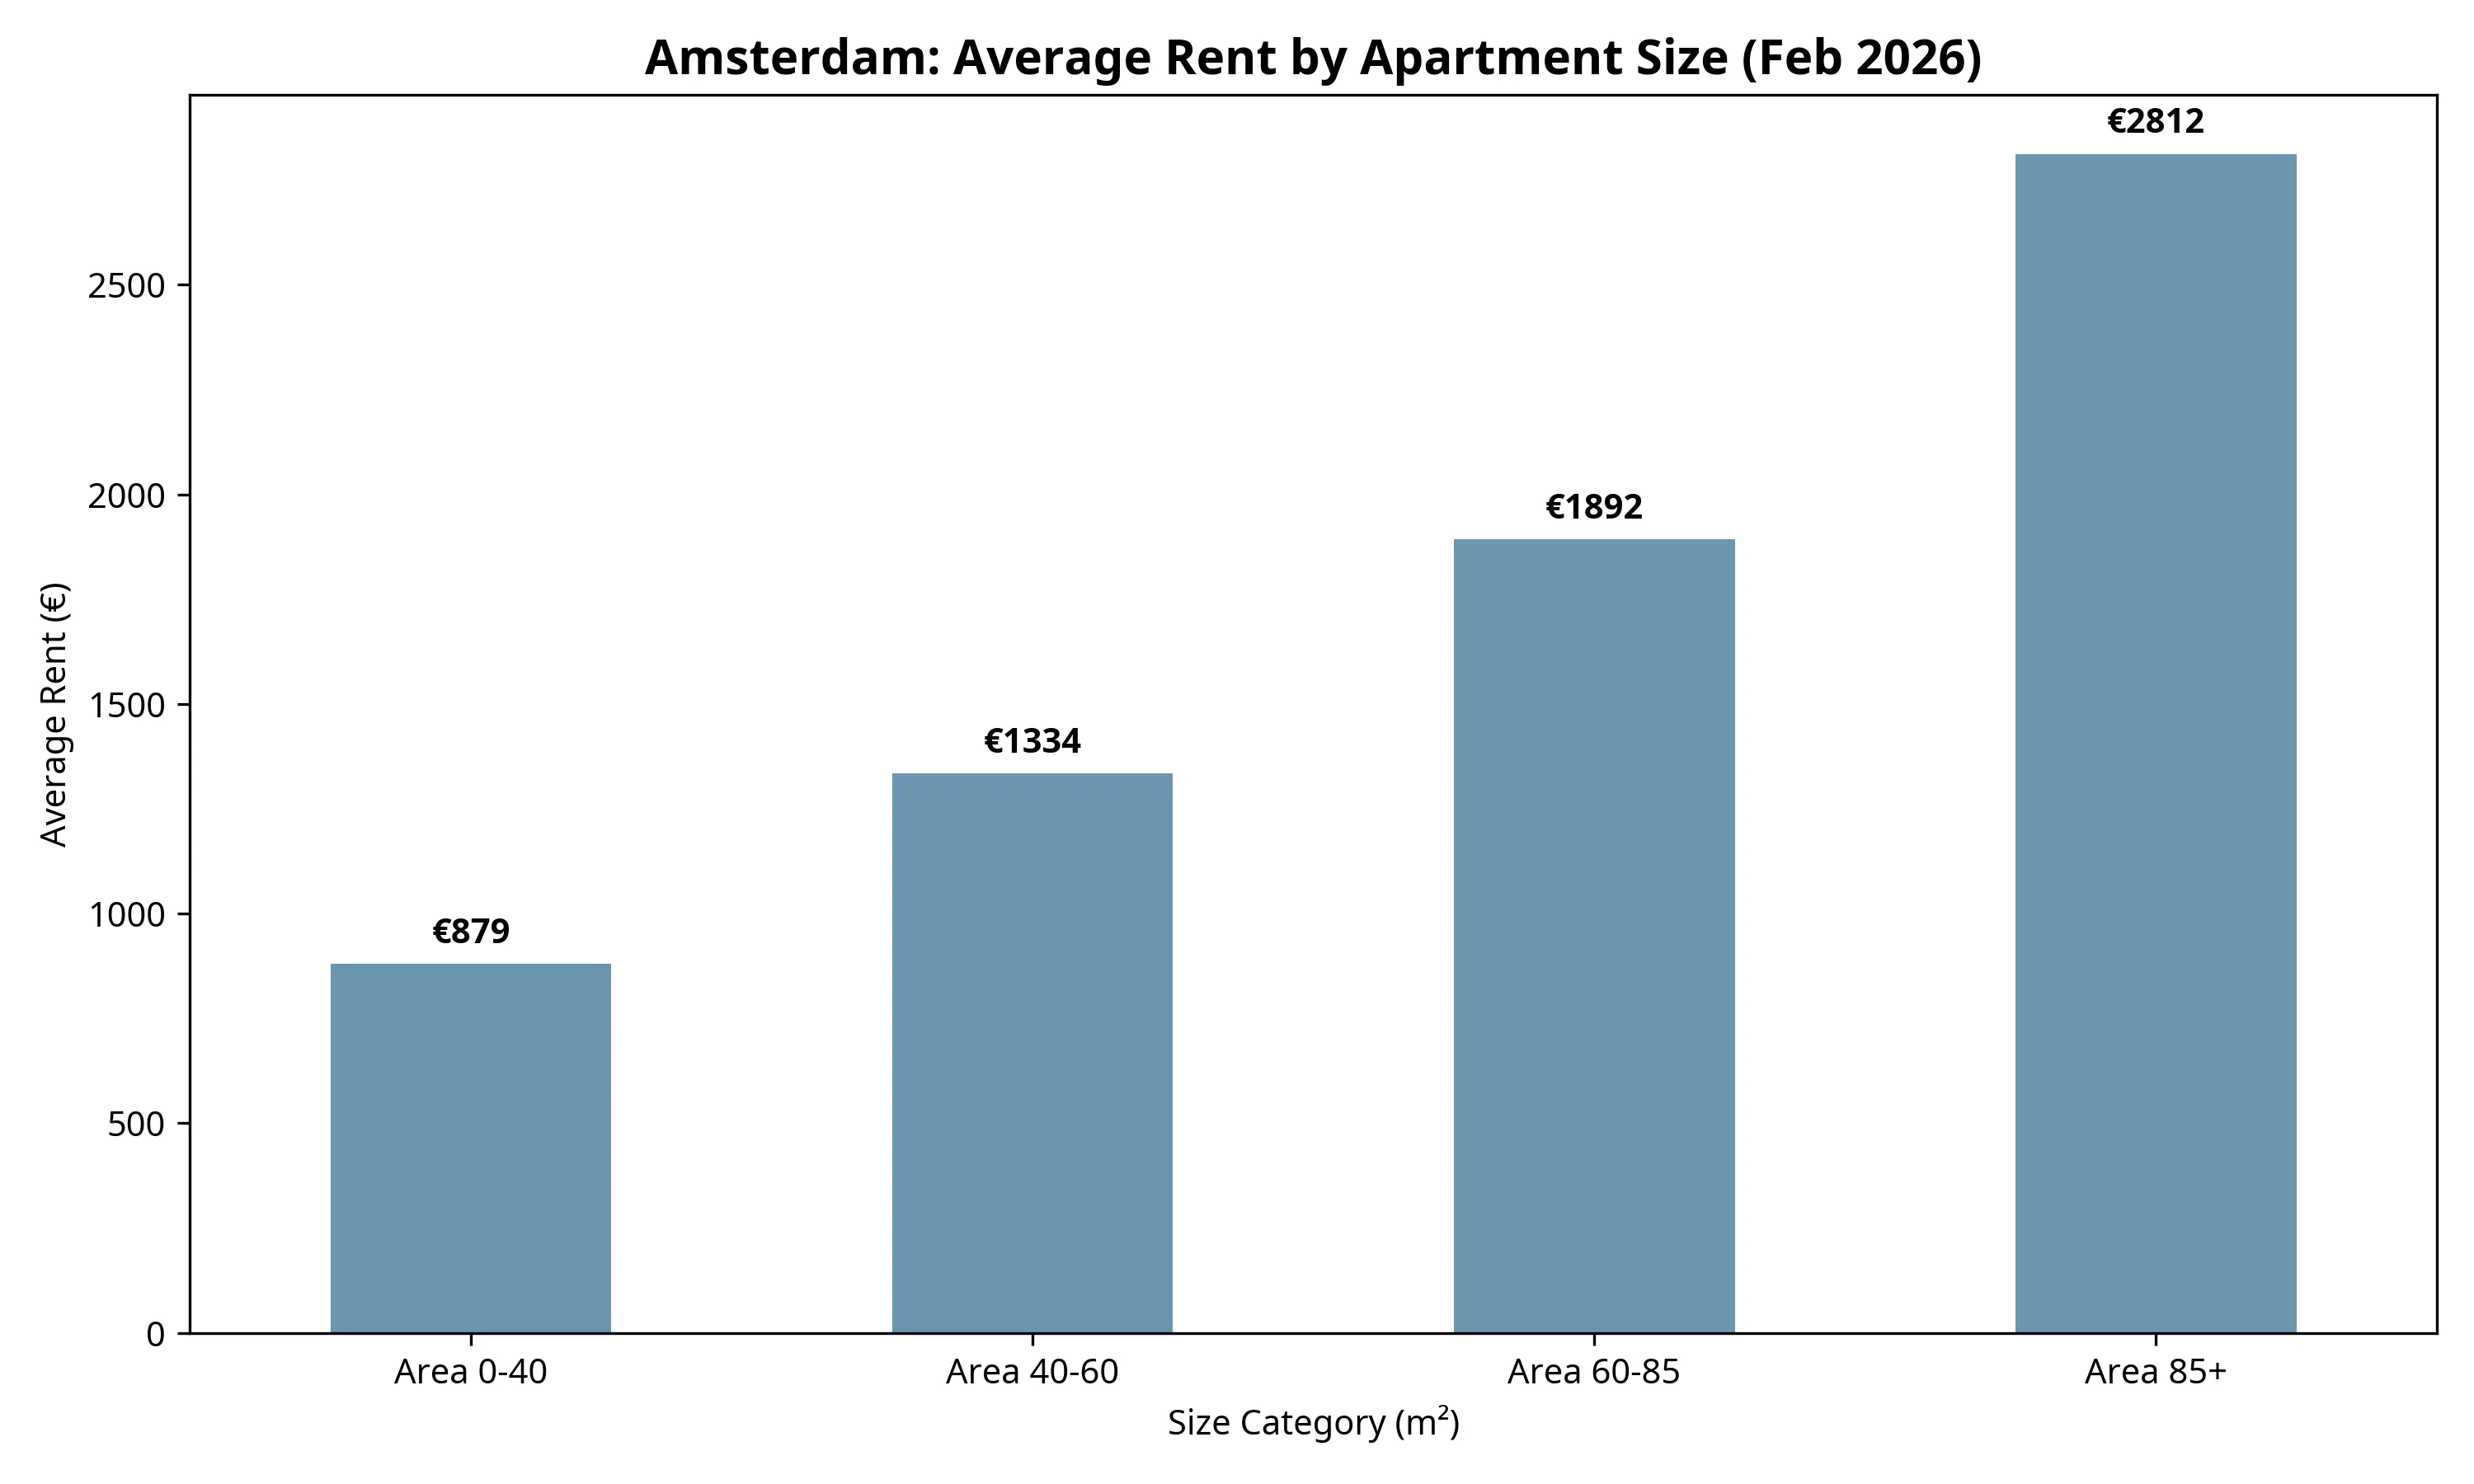
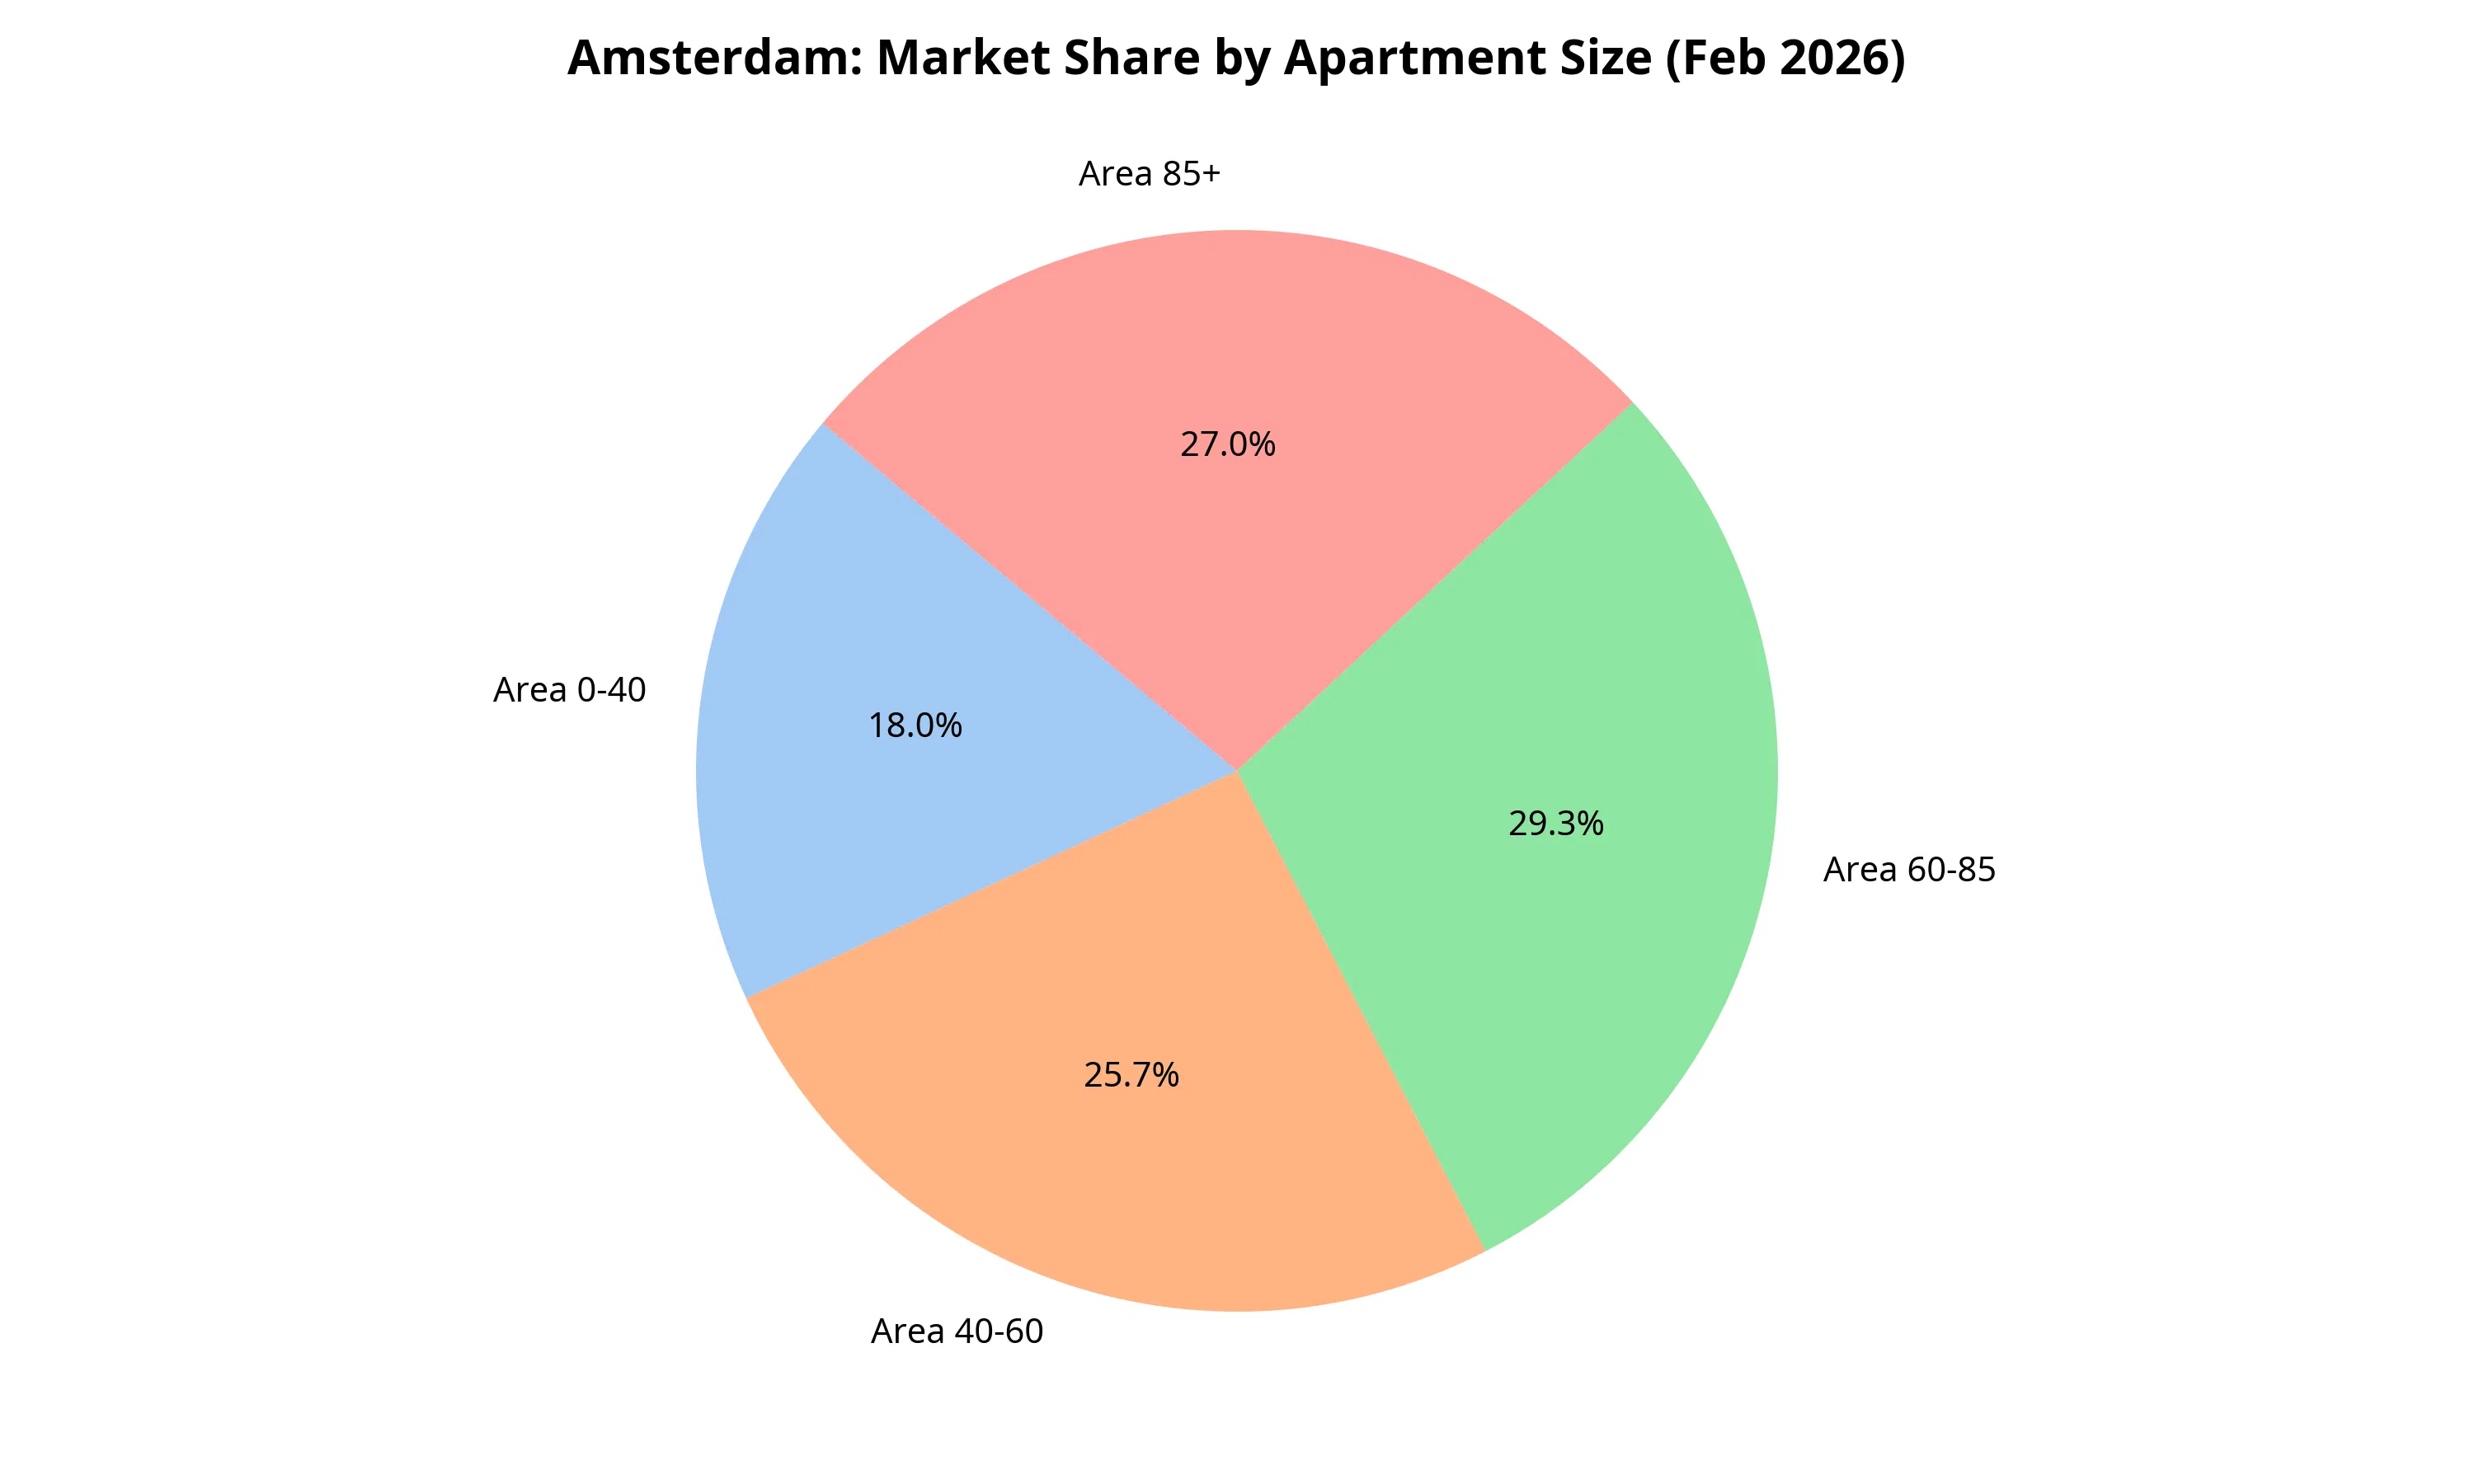
| Size Category | Avg Rent (€) | Median Rent (€) | Market Share (%) |
|---|---|---|---|
| Small (0-40 m²) | €874 | €786 | 13.8% |
| Medium (40-60 m²) | €1,334 | €1,032 | 20.4% |
| Large (60-85 m²) | €1,892 | €2,016 | 23.4% |
| Premium (85+ m²) | €2,812 | €2,667 | 42.4% |
Table 1: Amsterdam rental statistics by size category (Feb 2026). [2]
Market Insights:
- The Premium Dominance: Surprisingly, 42.4% of Amsterdam's new listings in February were in the 85m²+ category. This indicates that while the market for small and medium apartments is shrinking, the high-end luxury segment remains relatively active.
- The Studio Squeeze: Units under 40m² make up only 13.8% of the market. With an average price of €874, these are the most "affordable" options, but they are also the rarest and most competitive.
- The Family Barrier: For a standard family-sized apartment (60-85m²), renters must be prepared to pay nearly €1,900 per month. This requires a gross household income of at least €70,000 - €80,000 to satisfy most landlord requirements.
3. The "Notirent" Advantage: Speed in the Capital
In a market as constrained as Amsterdam's, the timing of your application is the single most important factor in your success.
Strategic Takeaways for Amsterdam:
- The 12:00 - 16:00 Window: Our data shows that Amsterdam listings are most likely to appear during the early afternoon. If you are not checking your notirent alerts during this window, you are likely missing out on the best properties.
- The "Dossier Ready" Requirement: Because 42% of the market is in the premium segment, landlords are extremely selective. Having a complete, professional dossier ready to send the moment a listing appears is mandatory.
- The Midweek Peak: Tuesday and Wednesday consistently show the highest volume of new posts in Amsterdam. Focus your search efforts on these days to maximize your options.
Final Verdict: Amsterdam remains a "landlord's market." While the volume of listings is higher than in other cities, the competition and price points are at record levels. For those who must live in the capital, speed, preparation, and a realistic budget are the only paths to success.
Stay tuned for Part 3, where we explore the "Other City Highlights" and find the hidden gems outside of Amsterdam!
Data Sources & News References: [1] "Housing Crisis Netherlands 2026: The Great Rental Vanishing," The Dutch Daily, Feb 12, 2026. [2] notirent.com internal market tracking data, Amsterdam Deep Dive, Jan-Feb 2026. [3] "Dutch housing shortage grows as investors turn their backs," DutchNews.nl, Feb 3, 2026.
Part 3: The Great Rental Vanishing – Trends, News, and the 2026 Housing Bottleneck
In the final part of our winter market review, we move beyond the raw numbers to explore the "why" behind the data. The trends we observed in January and February 2026—the shrinking supply, the volatile prices, and the regional shifts—are not happening in a vacuum. They are the direct result of a perfect storm of policy changes, economic pressures, and a record-breaking housing shortage that has fundamentally altered the Dutch rental landscape.
1. The "Uitponden" Tsunami: Why Your Next Apartment Just Went Up for Sale
The most striking trend in our two-month data is the 40% drop in new listings between early January and late February. This is not just a seasonal lull; it is the "Great Rental Vanishing Act" in full effect.
| Trend | Data Insight (Jan-Feb 2026) | Real-World Context & News |
|---|---|---|
| Supply Contraction | Amsterdam supply dropped from 578 to 203 weekly listings. | Landlords are "uitponden" (selling off) rental units at record rates due to the Affordable Rent Act [1]. |
| The Points Trap | Mid-sized units (40-60m²) are vanishing from the market. | The WWS Points System now caps rents for mid-market homes, making them financially non-viable for private investors [2]. |
| Tax Pressure | Average rents remain high despite lower supply. | The Box 3 Tax Trap on "fictitious returns" is forcing "mom-and-pop" landlords to sell to first-time buyers instead of renting [3]. |
Table 1: Connecting the data to the 2026 policy landscape.
Discussion Point: Is the government's attempt to protect tenants actually hurting them? By capping rents, they have inadvertently incentivized landlords to remove thousands of homes from the rental pool entirely. For the expat community, this means the "Free Sector"—the only sector they can realistically access—is evaporating.
2. The "Energy Label Apartheid": A New Barrier to Entry
Our February data revealed a significant price gap based on apartment size and quality. This is increasingly driven by the Energy Label of the property.
"In 2026, a house is no longer just about location; it's about its Energy Label. The new points system heavily penalizes homes with labels E, F, or G, pushing them into the regulated sector where rents are capped far below maintenance costs." — The Dutch Daily, Feb 12, 2026 [1].
The Impact on Renters:
- The Loss of "Charm": Those classic, uninsulated 1930s apartments in Amsterdam's Oud-West are being sold off because landlords cannot afford the mandatory sustainability upgrades.
- The Premium Only Market: The only new rentals hitting the market are hyper-modern, high-performance units (Label A or better). While these are energy-efficient, they are also the most expensive, often exceeding €2,500 per month.
- The Renovation Debt: First-time buyers are snapping up the drafty units that used to be rentals, further shrinking the pool for those who aren't ready to buy.
3. Regional Highlights: Finding Value in a Shrinking Market
While Amsterdam is the bottleneck, our two-month summary reveals some surprising "hidden gems" and "warning signs" across the other major cities.
| City | The "Vibe" | 2-Month Insight | Strategic Advice |
|---|---|---|---|
| Utrecht | The Value Hub | Avg Rent: €1,285. High volume of mid-sized units. | The best alternative to Amsterdam. Move fast; the secret is out. |
| The Hague | The Premium King | Avg Rent: €2,089. Often more expensive than Amsterdam. | Focus on the international zone, but be prepared for "Amsterdam-level" prices. |
| Groningen | The Student Fortress | Avg Rent: €1,136. Lowest prices, but lowest volume. | Perfect for budget seekers, but you need months of lead time. |
| Rotterdam | The Vanishing Act | Avg Rent: €1,963. Supply dropped 50% in 8 weeks. | No longer the "affordable" city. Treat it with the same urgency as Amsterdam. |
Table 2: Regional market profiles and strategic advice.
4. The "Housing-Driven Resignation": A Warning to Multinationals
Perhaps the most alarming trend of early 2026 is the rise of "Housing-Driven Resignation." HR departments across the Randstad report that 15% of new international hires are rescinding their contracts within 90 days because they simply cannot find a place to live [1].
Why this matters for you:
- The "Triple Threat": As an expat, you are ineligible for social housing, targeted by the vanishing mid-market, and often lack the credit history to buy immediately.
- The 11 AM Rule: In this environment, speed is your only weapon. Our data confirms that the 12:00 - 16:00 window is when the "new blood" hits the market. If you aren't using a tool like notirent for instant alerts, you are effectively invisible to the market.
Final Verdict: The 2026 Survival Strategy
The Netherlands is no longer a nation of easy rentals; it is a nation of owners and "lucky" tenants. To be one of the lucky ones in 2026, you must:
- Secure Housing First: Do not wait until you arrive. Start your search and set your alerts weeks before your flight.
- Broaden Your Horizon: If Amsterdam is a bottleneck, look at Utrecht or Eindhoven immediately.
- Be "Dossier Ready": In a market with a 410,000-unit shortage [4], landlords don't pick the best tenant; they pick the first qualified one.
Stay ahead of the curve with notirent.com—where data meets the reality of the Dutch housing market.
Data Sources & News References: [1] "Housing Crisis Netherlands 2026: The Great Rental Vanishing Act," The Dutch Daily, Feb 12, 2026. [2] "Addressing high rents: the impact of the Netherlands' Affordable Rent Act," Housing Europe, May 20, 2024. [3] "Dutch private rental market shrinks as investors sell off," Reddit /r/EU_Economics, Feb 26, 2026. [4] "Dutch housing shortage rises to 410,000 homes," NL Times, Feb 3, 2026. [5] "ABN AMRO: Housing market monitor - Will 2026 be an unexceptional year?" ABN AMRO, Jan 11, 2026.
How this observation is made
We monitor major Dutch rental platforms continuously, checking for new listings every few seconds. Our system verifies listings, removes duplicates, and categorizes them by location, price, and property type. This data represents publicly listed, verifiable rentals only.
Curious about supply for your search?
Explore recent listings by city and budget using our rental market explorer.
Updated continuously from major Dutch rental platforms.
Explore the MarketMore Weekly Market Brief
Weekly Market Insight: Netherlands Rental Dynamics (Feb 07 - Feb 14, 2026)
Market volume by region, Amsterdam deep dive, and city highlights for the week ending February 14, 2026.
Weekly Market Brief — Netherlands Rental Dynamics (Week 3, 2026)
Third week of January 2026: three-week volume trend, Week 3 prices and trends, and consistency of listing rhythms.