Weekly Market Brief — Netherlands Rental Dynamics (Week 1, 2026)
Want to see what rentals are appearing right now?
Explore the MarketThe January Rental Surge: A New Year, A New Housing Battle (Jan 03 - Jan 10, 2026)
Published: January 12, 2026
As the holiday season fades, the Dutch rental market has roared back to life with a massive influx of new listings. The first full week of January 2026 reveals a market that is both highly centralized and increasingly expensive. With the national housing shortage still looming at over 400,000 units [1], the latest data from the week ending January 10 shows that the "New Year's Resolution" for many is finding a new home—but at what cost?
1. The Supply Landscape: Amsterdam's Absolute Dominance
The week ending January 10, 2026, confirms that Amsterdam remains the undisputed epicenter of the Dutch rental market. The capital alone provided more new listings than the next four largest cities combined.
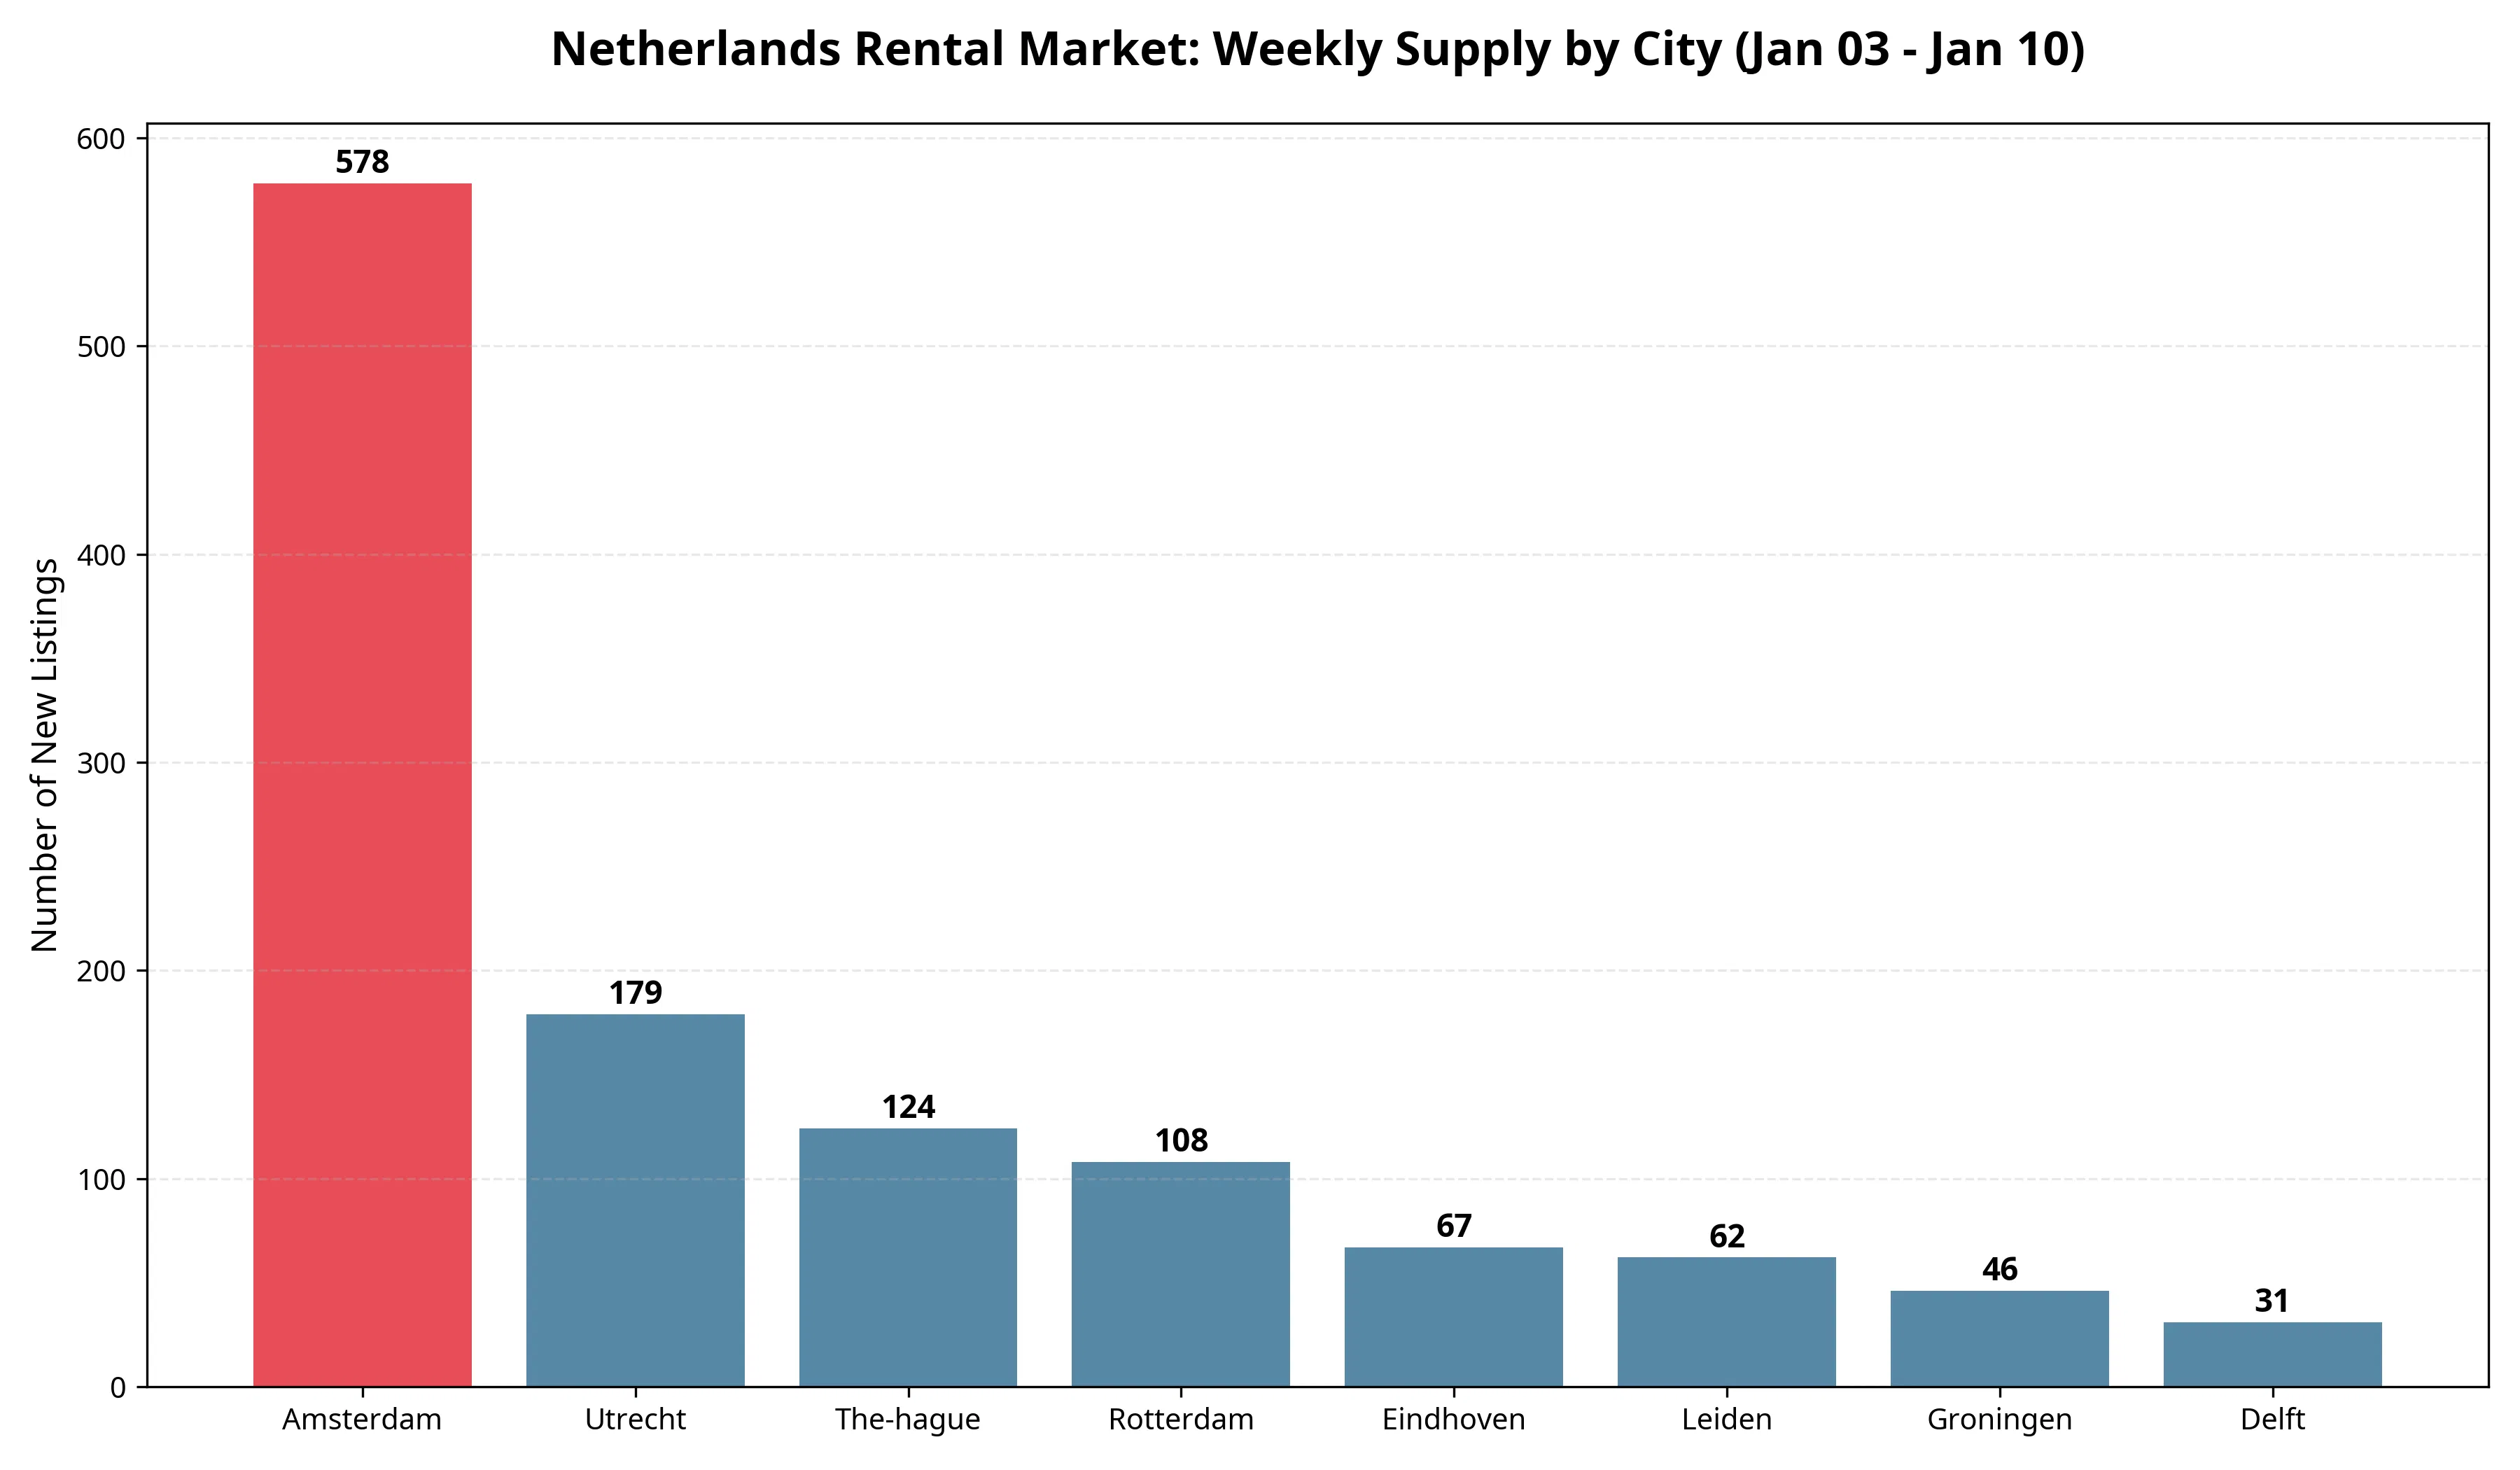
| City | Total New Listings | Market Share (%) |
|---|---|---|
| Amsterdam | 578 | 48.4% |
| Utrecht | 179 | 15.0% |
| The Hague | 124 | 10.4% |
| Rotterdam | 108 | 9.0% |
| Eindhoven | 67 | 5.6% |
| Leiden | 62 | 5.2% |
| Groningen | 46 | 3.9% |
| Delft | 31 | 2.6% |
Table 1: Total new listings by city for the week ending Jan 10. [2]
News Insight: With nearly 50% of the regional supply concentrated in Amsterdam, the city is the primary destination for international talent and domestic movers alike. However, this high volume is met with even higher demand, keeping the market in a state of permanent "overheat."
2. The Price of Living: The €2,000 Barrier
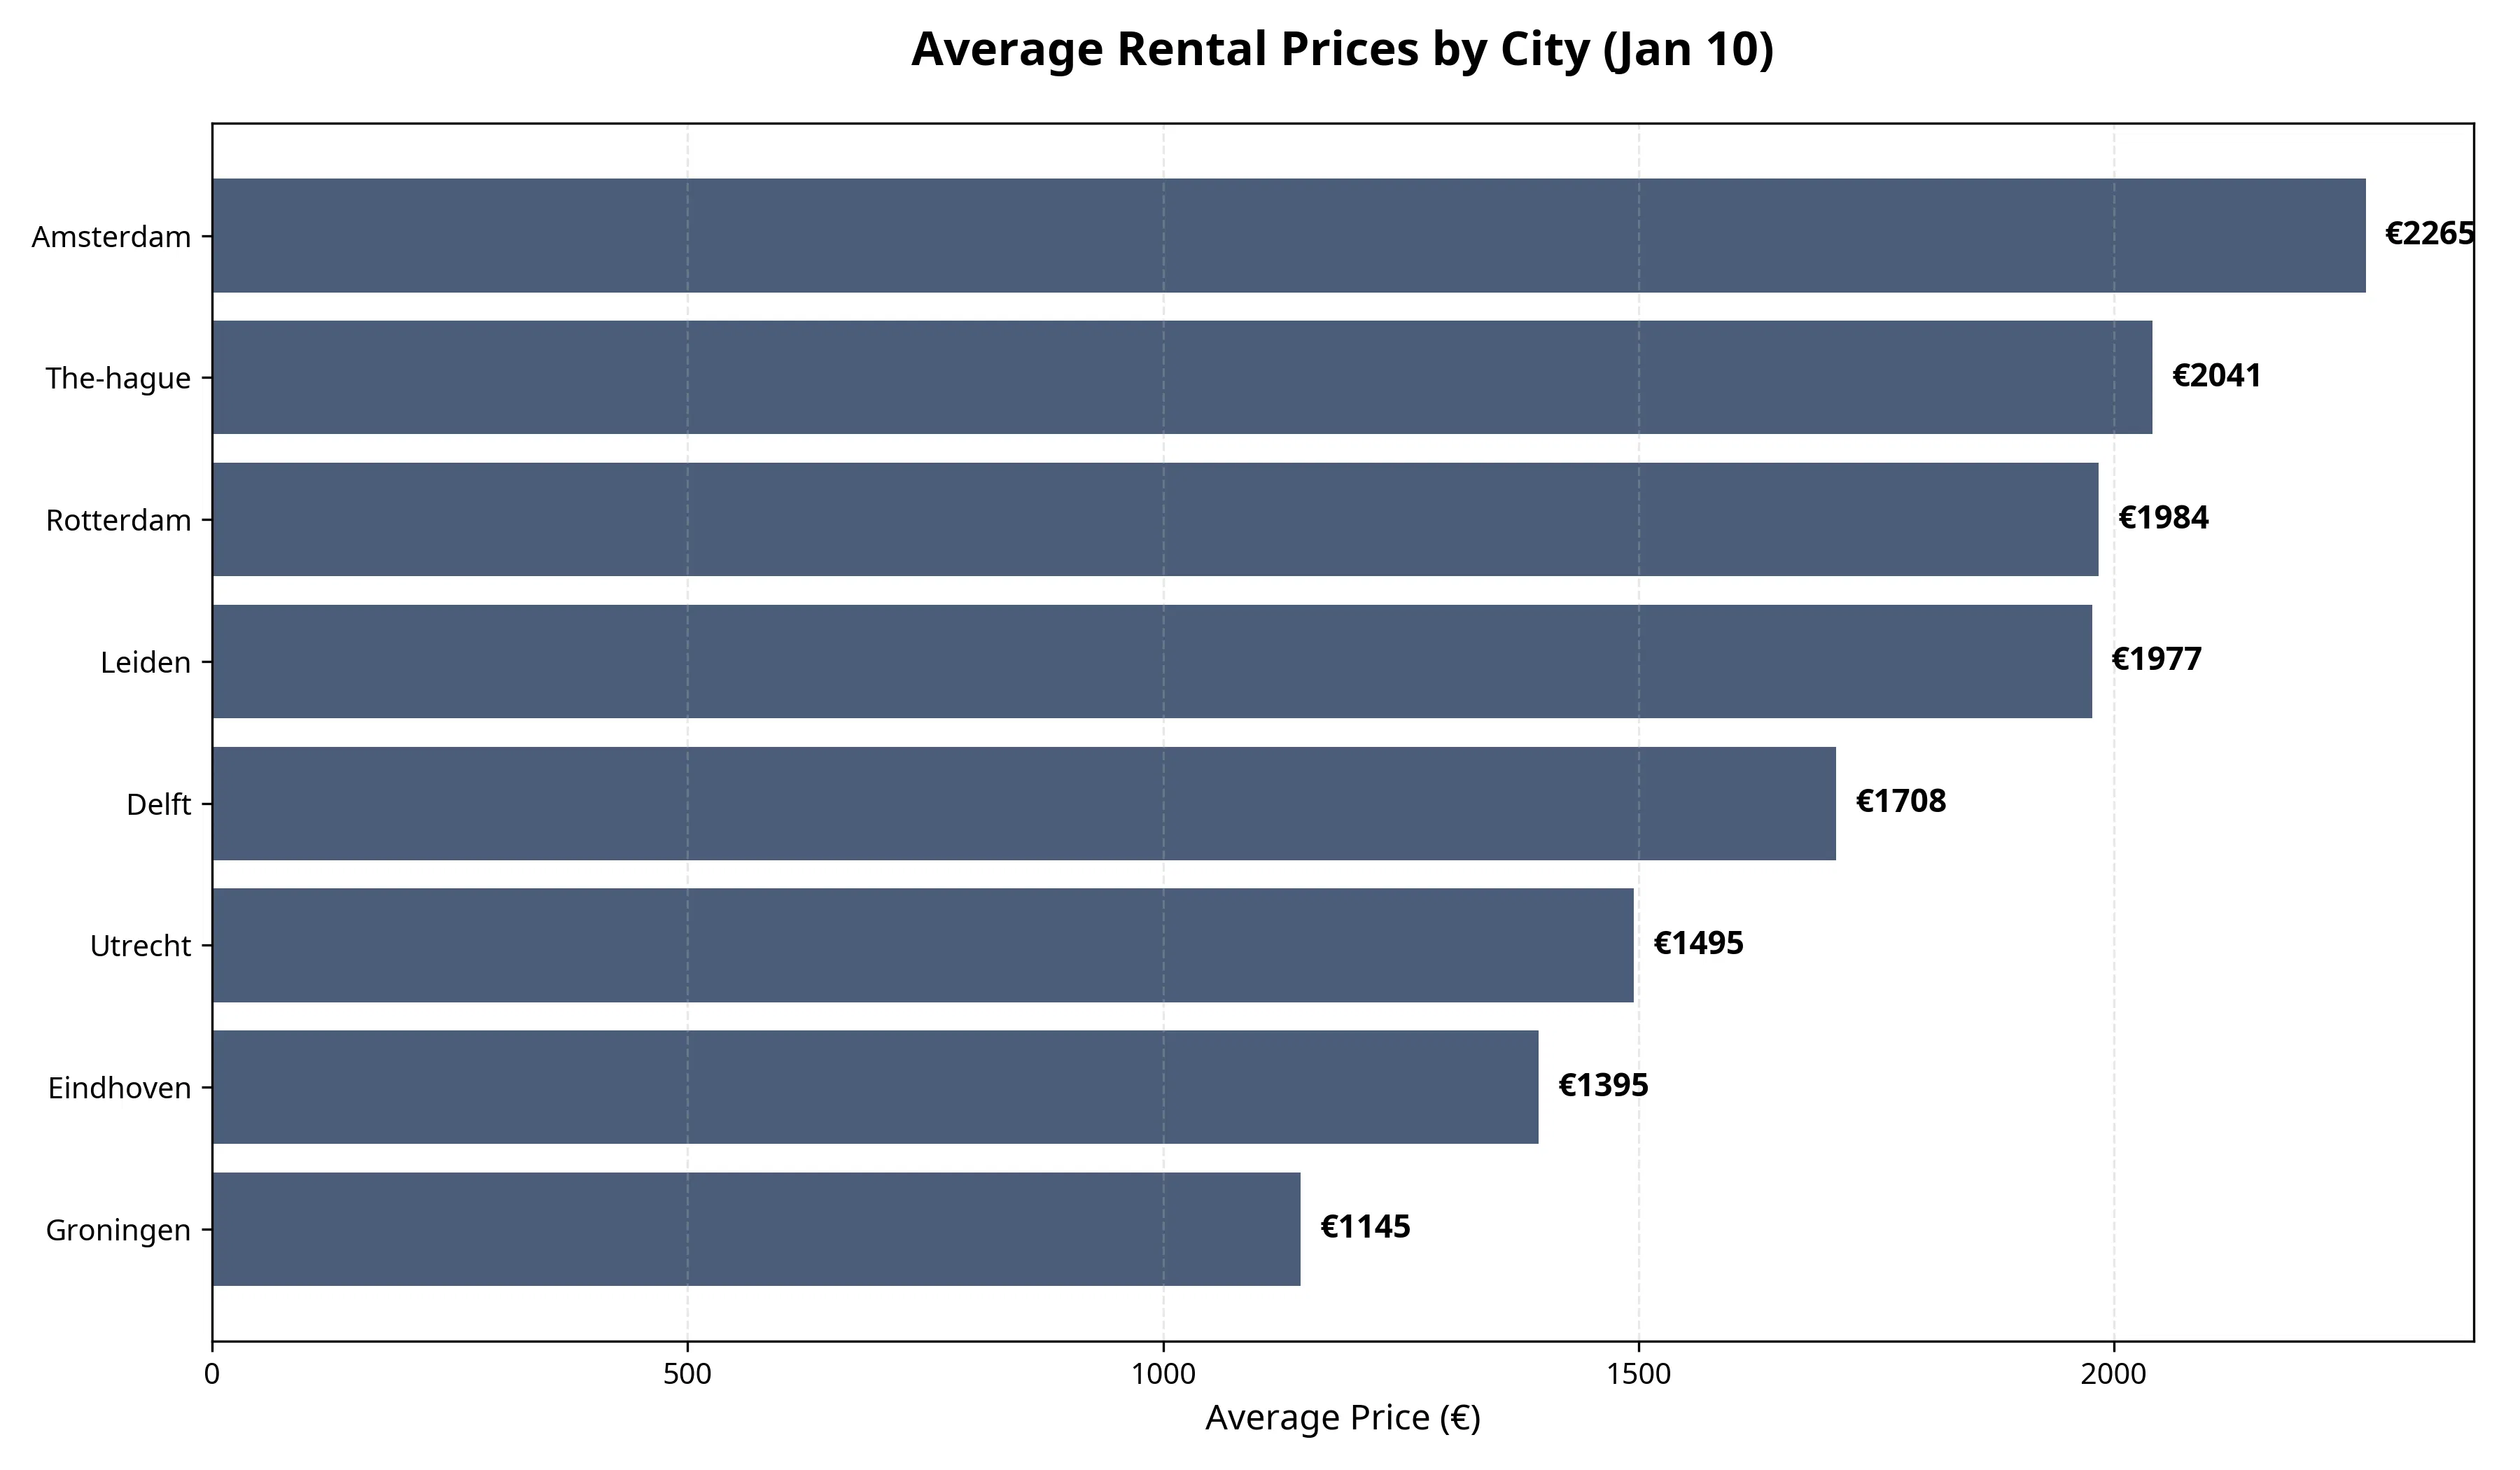
Rental prices in the Randstad have started the year on a high note, with three major cities now averaging over €2,000 per month.
The Lifestyle Analysis:
- The Premium Tier: Amsterdam (€2,265), The Hague (€2,041), and Rotterdam (€1,984) have solidified their positions as the most expensive hubs. For a single professional, these prices often consume more than 40-50% of net income, far exceeding the recommended 30% threshold.
- The Value Alternatives: Utrecht (€1,495) and Eindhoven (€1,395) offer a significant "lifestyle discount" while still providing high-quality urban living and strong job markets.
- The Student/Budget Hub: Groningen (€1,145) remains the most accessible major city, though its distance from the Randstad makes it a specific choice for those not tied to the western economic core.
3. City Highlights: Where to Look?
- Amsterdam: The sheer volume (578 listings) means there is always something new, but the average price of €2,265 is a brutal entry point.
- Utrecht: With 179 listings and an average price €770 lower than Amsterdam, Utrecht is the most rational choice for those seeking a balance between "vibrancy" and "affordability."
- Leiden: A surprise contender with 62 listings and a high average price of €1,977, reflecting its status as a highly desirable, supply-constrained academic and biotech hub.
4. Strategic Takeaways: Navigating the January Rush
The data from the first week of the year suggests a market that rewards the prepared and the flexible.
- The Income-to-Rent Reality: To comfortably afford an average apartment in Amsterdam, a household needs a gross income of at least €80,000 - €90,000. In Eindhoven or Utrecht, that same lifestyle is accessible at €55,000 - €65,000.
- The "New Year" Effect: January is historically one of the busiest months for the rental market. The high volume of listings is matched by a high volume of searchers. Speed is your only competitive advantage.
- Quality of Life vs. Prestige: Choosing a city like Eindhoven or Utrecht over Amsterdam can save a renter over €9,000 per year in rent alone—money that can be redirected toward travel, savings, or a higher standard of living.
Final Advice: If you are starting your search this January, don't just follow the crowd to Amsterdam. The data shows that cities like Utrecht and Eindhoven offer a much better "price-to-quality" ratio. However, regardless of the city, ensure your dossier is ready and your alerts are set. In this market, the best homes are gone before the first viewing is even scheduled.
Stay tuned to notirent.com for the latest data-driven insights into the Dutch rental market!
Data Sources & News References: [1] "Dutch housing shortage grows as investors turn their backs," DutchNews.nl, Feb 3, 2026 (Reference to ongoing 2026 crisis). [2] notirent.com internal market tracking data, week ending January 10, 2026.
How this observation is made
We monitor major Dutch rental platforms continuously, checking for new listings every few seconds. Our system verifies listings, removes duplicates, and categorizes them by location, price, and property type. This data represents publicly listed, verifiable rentals only.
Curious about supply for your search?
Explore recent listings by city and budget using our rental market explorer.
Updated continuously from major Dutch rental platforms.
Explore the MarketMore Weekly Market Brief
Weekly Market Insight: Netherlands Rental Dynamics (Feb 07 - Feb 14, 2026)
Market volume by region, Amsterdam deep dive, and city highlights for the week ending February 14, 2026.
Weekly Market Brief — Netherlands Rental Dynamics (Week 3, 2026)
Third week of January 2026: three-week volume trend, Week 3 prices and trends, and consistency of listing rhythms.